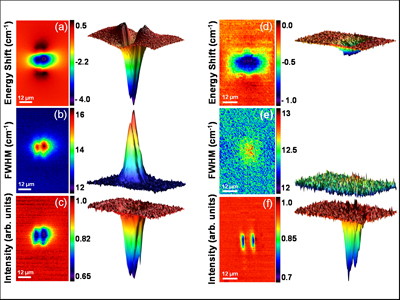

Analysis of the luminescence properties of neodymium laser ions along the cross section of the fabricated waveguide allows visualizing the different kind of structural modifications incluced by the laser microfabrication technique inside the crystal sample. The LabSpec software permits analyzing the emitted luminescence peaks and thus obtain a 3D map of intensity, FWHM and energy position of each sub-Stark transition peak at 940 nm.
The intensity map depicts the irreversible laser damage, which causes a decrease in the luminescence intensity. The FWHM map depicts the laser induced disorder on the crystalline matrix. The Energy Shift map depicts the laser induced stress, consisting of both compressive and tensile stresses around the irradiated volume.
The left column corresponds to 2D and 3D plots in the fabricated optical waveguide, whilst the column on the right depicts the changes after an annealing process is performed, which erases the thermally reversible laser induced lattice defects.
Data courtesy of Laser Spectroscopy Group (GIEL), Universidad Autónoma de Madrid, Spain