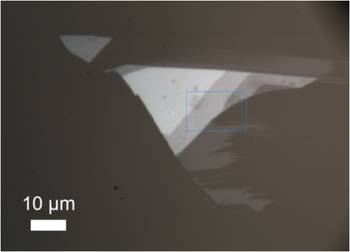

Optical image of MoS2 region

Mapping region with optical image (left) and Raman CLS fitting multivariate image (right). The number of layers is indicated on the raman image.

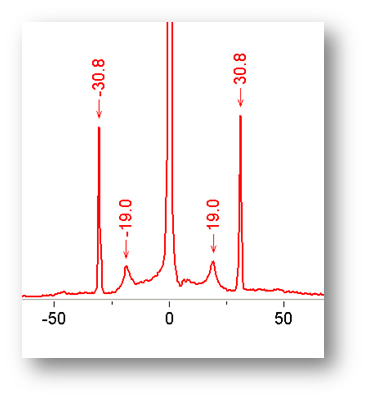
Low frequency spectrum (5 layer region) showing the distinct shear mode peaks.
MoS2 takes a layered structure similar to Graphene, and thus in a bulk form can be use as a lubricant; as a 2D structure it shows interesting new properties with possible applications in the production of fast transistors and photodetectors.
Raman spectroscopy is used to characterize the crystal structure and, in particular, the number of layers (knowing that the “single layer” is made of three atomic layers S-Mo-S). The "classical" Raman method utilizes peak fitting of the two high frequency peaks between 380 cm-1 and 415 cm-1 and then calculating the difference between their positions - this difference corresponds to the number of layers. The difficulty is this difference becomes smaller as the number of layers grows and thus the contrast of the image is poor.
Low frequency peaks (arising from shear modes) in the sub-35cm-1 region are much better resolved and even simple cursor analysis yields easily interpretable results. The problem is that as a shear mode is a mode arising from the interaction of two layers it is not possible to observe monolayer regions.
HORIBA Scientific’s Ultra Low Frequency (ULF) module allows data including both high and low frequency modes to be easily recorded. Subsequent multivariate analyssi can yield high contrast images, as displayed here, benefiting from high contrast (from the low frequency modes) and including mono-layer distribution (from the high frequency modes).
Sample courtesy of A. Shukla, IMPMC, Pierre and Marie Curie University, France.
Reference: M. Boukhicha et al., Phys. Rev. B, 2013, 87, 195316